When it comes to detecting, capturing and analysing malware, the hard drive isn’t so important unless we’re establishing a timeline for how it got there. The kernel and anything that’s running on a system lives in memory, plus it’s where the unencrypted/unobfuscated malware payloads are. System memory is also the one place we’re likely to find cryptographic keys, if we’re really desperate and know roughly where to look.
Where to begin? As with Windows processes, the processes in UNIX-based systems are contiguous data structures, containers created by the kernel for running programs. They contain everything a program might need, including an image of the executable, links to external .so objects (roughly analogous to Windows DLLs), variables, runtime data, etc. A process has a definite logical structure, although that’s not immediately apparent outside textbooks.
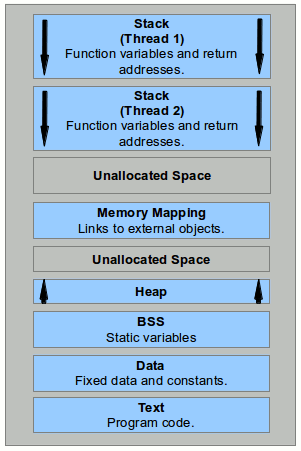
The most lucid representations I could find were by Gustavo Duarte and a Lawrence Livermore National Laboratory tutorial, which I’ve merged for clarity:

Of course, the stack is also in there, where variables passed to whatever functions and return addresses are found. According to the LLNL tutorial, threads are written to and from the stack.
procfs
This is important, because system monitoring tools will almost always get their information from something called
procfs. Practically everything in a UNIX system is represented by a file – sometimes files are created as interfaces or pointers to something physical. From the user perspective procfs is the
/proc directory, which contains a number of virtual directories and files (existing entirely in system memory) representing low-level stuff such as processes, memory allocations and hardware components. Most the
procfs files can be accessed directly.
The common way to find what’s running on a machine is the ‘
top‘ command, but it’s only going to show processes that are active or being awakened, and not suspended/dormant processes. This is where ‘
ps‘ command becomes a handy alternative:
#ps -el
Lists all processes resident in memory:
ps-el
But, as Prof. Andrew Blyth would say, ‘user-space is a lie’, meaning the user-space programs can only report what kernel-space tells it. The implication is that a kernel-mode rootkit can hide information about processes and network activity from user-space, and Android OS is a total bitch for doing precisely that (unless the device is rooted).
With typical Linux desktops and servers, there are various ways around this. One of them is using unhide to catch discrepencies between CPU, memory usage and what
/bin (or
/sbin) executables report, and another method compares system calls with a fixed system call map.
Back to the list of processes: Having got the PIDs for active and dormant processes, and having found which programs they might belong to, a considerable amount about a given process can be learned by reading from
/proc.
The directories of interest are listed to the left, when using the ‘
ls‘ command. The directory names are the PIDs for processes resident in memory, and each contains a number of virtual files.
To get a rough picture of what the process contains, pmap is worth trying:
#pmap 2586
This appears to do pretty much the same thing as:
#cat maps
Of course, the contents can be dumped to a text file with
#cat maps >> dumpfile.txt
Two values that might be important, which tell us the start and end addresses for the memory allocated to a process:
- vm_start – First address within virtual memory.
- vm_end – First address outside virtual memory.
Other files of interest include:
- /proc/[PID]/exe: Contains symbolic links to the executable binary file.
- /proc/[PID]/limits: Resource limits assigned to the process.
- /proc/[PID]/maps: A memory map of the process.
- /proc/[PID]/sched: Thread scheduling stats for the threads generated by the process.
 Of course, the stack is also in there, where variables passed to whatever functions and return addresses are found. According to the LLNL tutorial, threads are written to and from the stack.
 Of course, the stack is also in there, where variables passed to whatever functions and return addresses are found. According to the LLNL tutorial, threads are written to and from the stack.