HTML Form Elements and Events
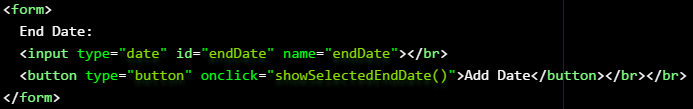
The button code calls the function
showSelectedEndDate():
                function showSelectedEndDate()
                {
                    var d = new Date(endDate.value);
                    document.getElementById("myenddate").innerHTML = d;
                }
This defines variable '
d' as a new instance of '
Date', and passes the value from the date picker named '
endDate'. The variable is then set as the inner HTML content of the '
myenddate' DIV element. With drop-down menus the principle is the same, but the '
onchange' event listener is used to call '
showSelectedMessageType()' if the selected item is changed:
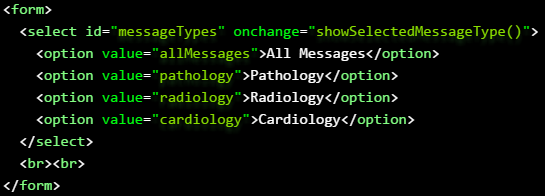
                function showSelectedMessageType()
                {
                    var x = document.getElementById("messageTypes");
                    var i = x.selectedIndex;
                    document.getElementById("mymessagetype").innerHTML = x.options[i].text;
                }
amCharts Events
Certain optional features of amCharts can save us writing code to filter JSON values. Charts can be
made responsive to user input with:
chart.responsive = { "enabled": true };
One of these is a scroll bar for the serial charts:
                var chartScrollbar = new AmCharts.ChartScrollbar();
                chart.addChartScrollbar(chartScrollbar);
And other features enable the user to zoom in on selected parts of the serial and column charts:
                chartCursor.zoomable = true;
                chart.mouseWheelZoomEnabled = true;
The
amCharts Live Maker enables you to create a chart and test these options before any coding.
Switching Chart Views
Finally, we might want a feature that enables the user to switch between chart views. HTML tabs can be used for this. First we need buttons:
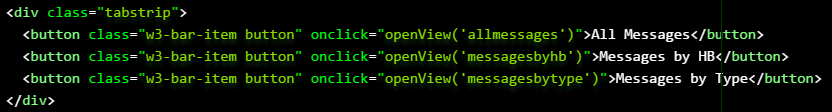
And the JavaScript event handler:
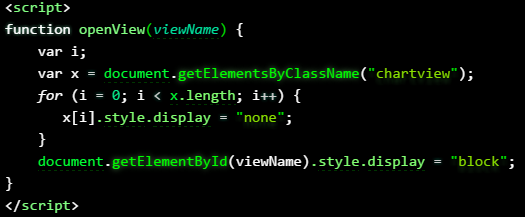
And place all the content for whichever chart in one of the tab DIV elements, as normal. With the correct CSS, the tab containers themselves can he hidden, so it appears the user is switching between charts with the three buttons.
References
AMCHARTS. 2017. Knowledge Base.
Making charts and maps responsive. [WWW].
https://www.amcharts.com/kbase/making-charts-responsive/. 31st May 2017.